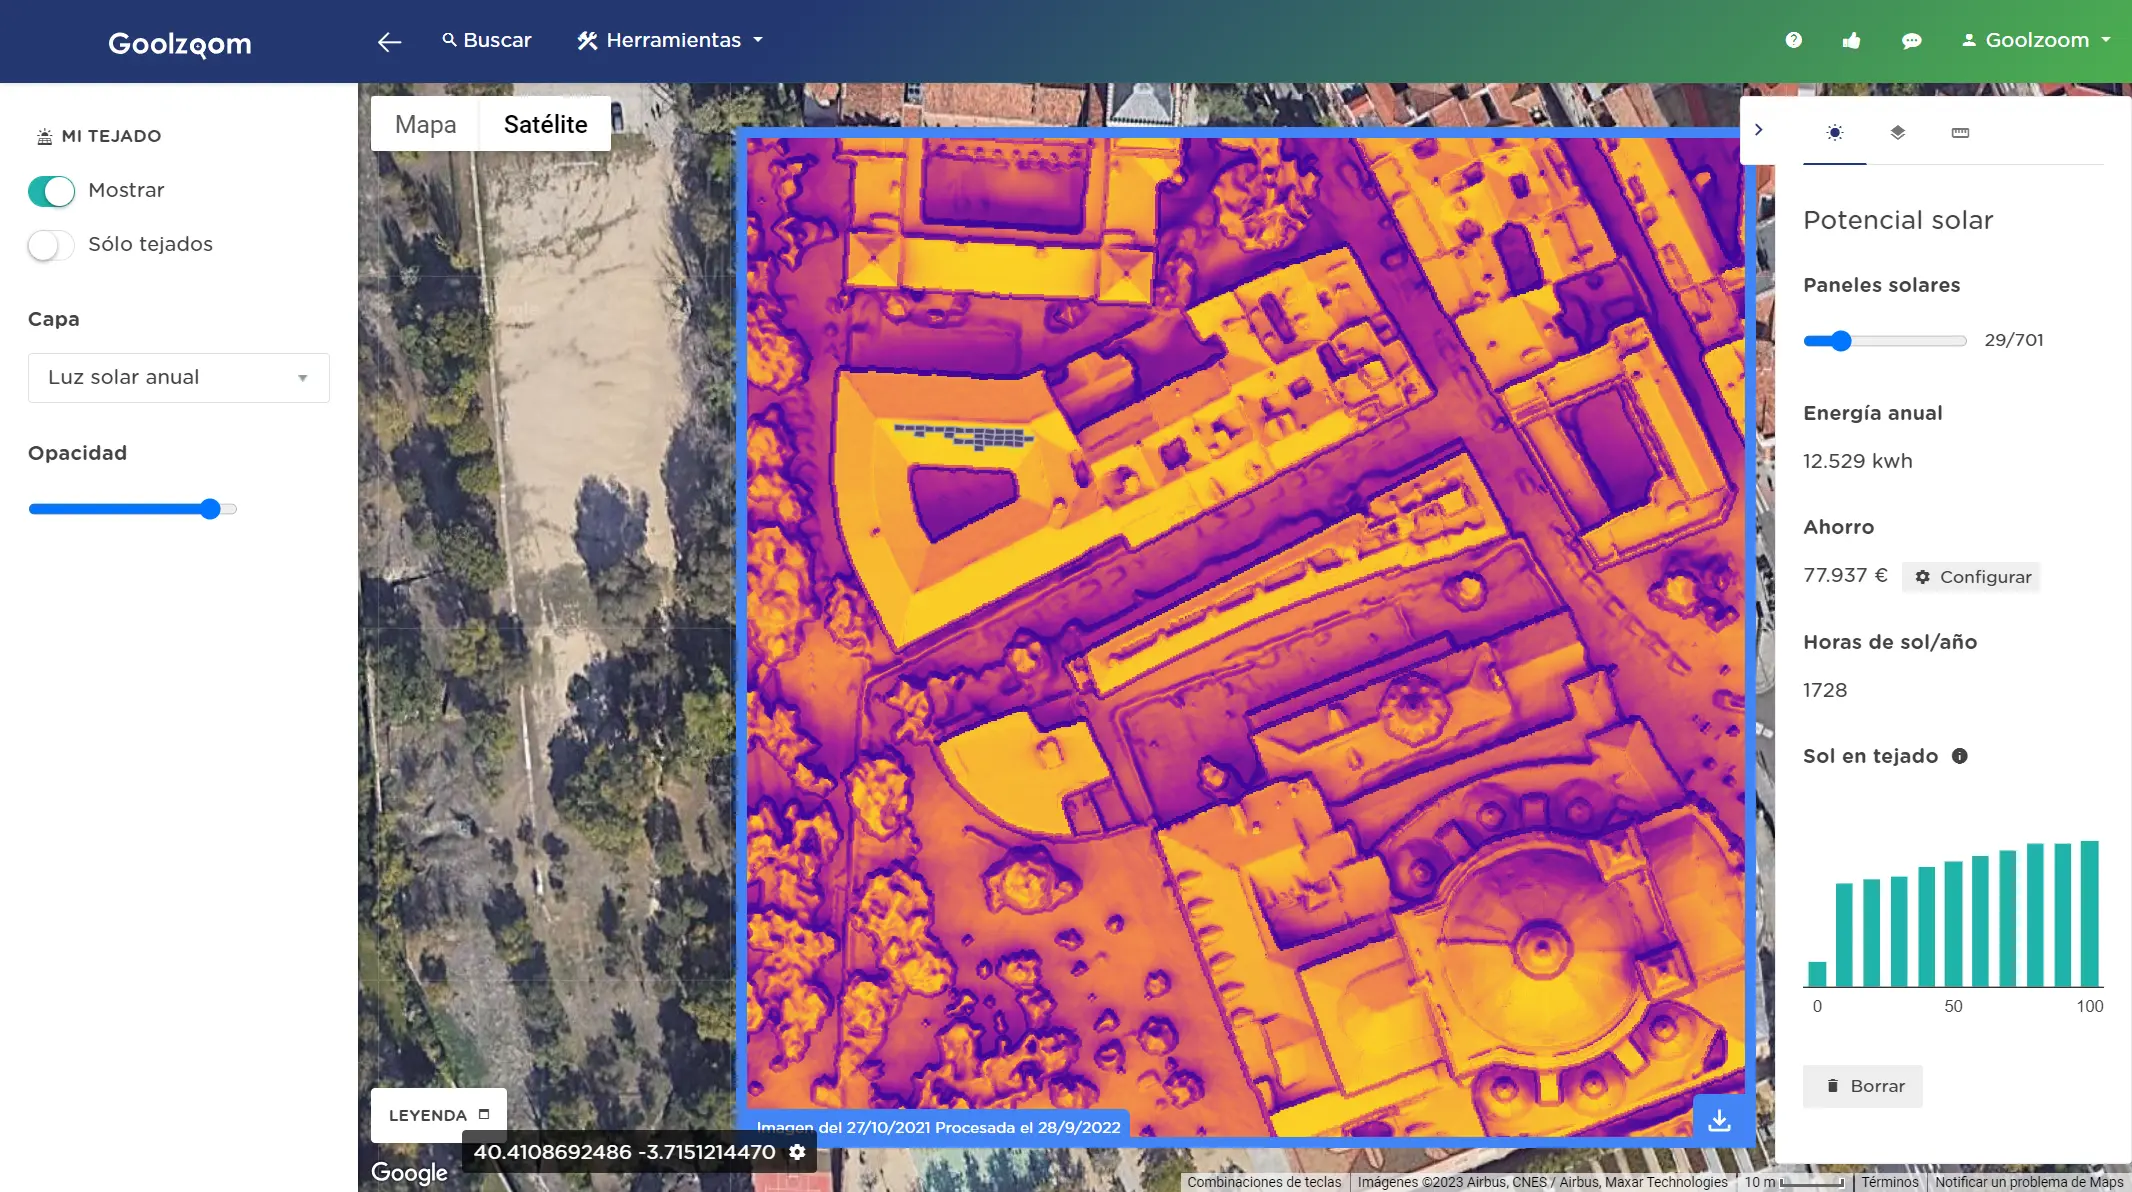
How much sun does your roof get?
Search for an address or select a roof on the map. Where building data is available, you can see its sun exposure and try a solar panel layout.
Explore the example areaYou need a Goolzoom account to use My Roof.
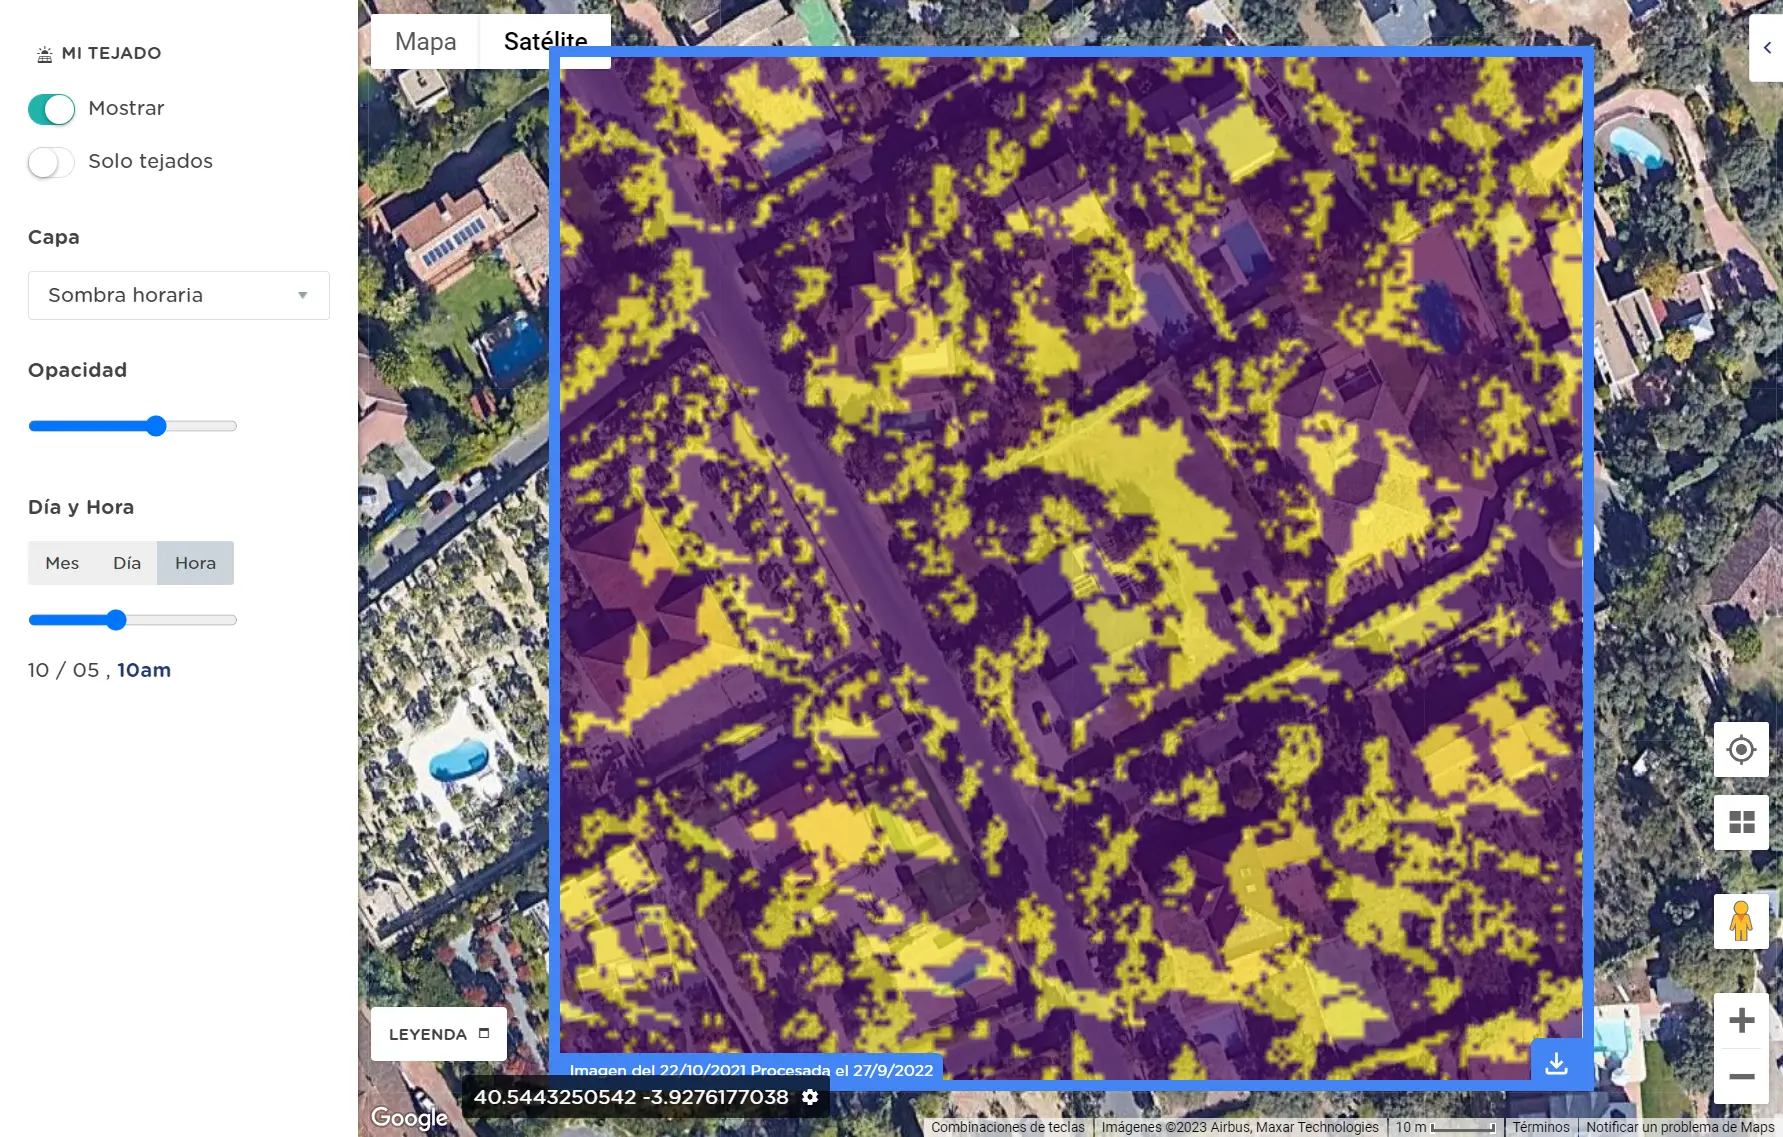
See when shadows fall
Change the date and time in the hourly shade layer to see which parts of the roof are in shadow. Use the annual sunlight layer to identify the areas with the most exposure.
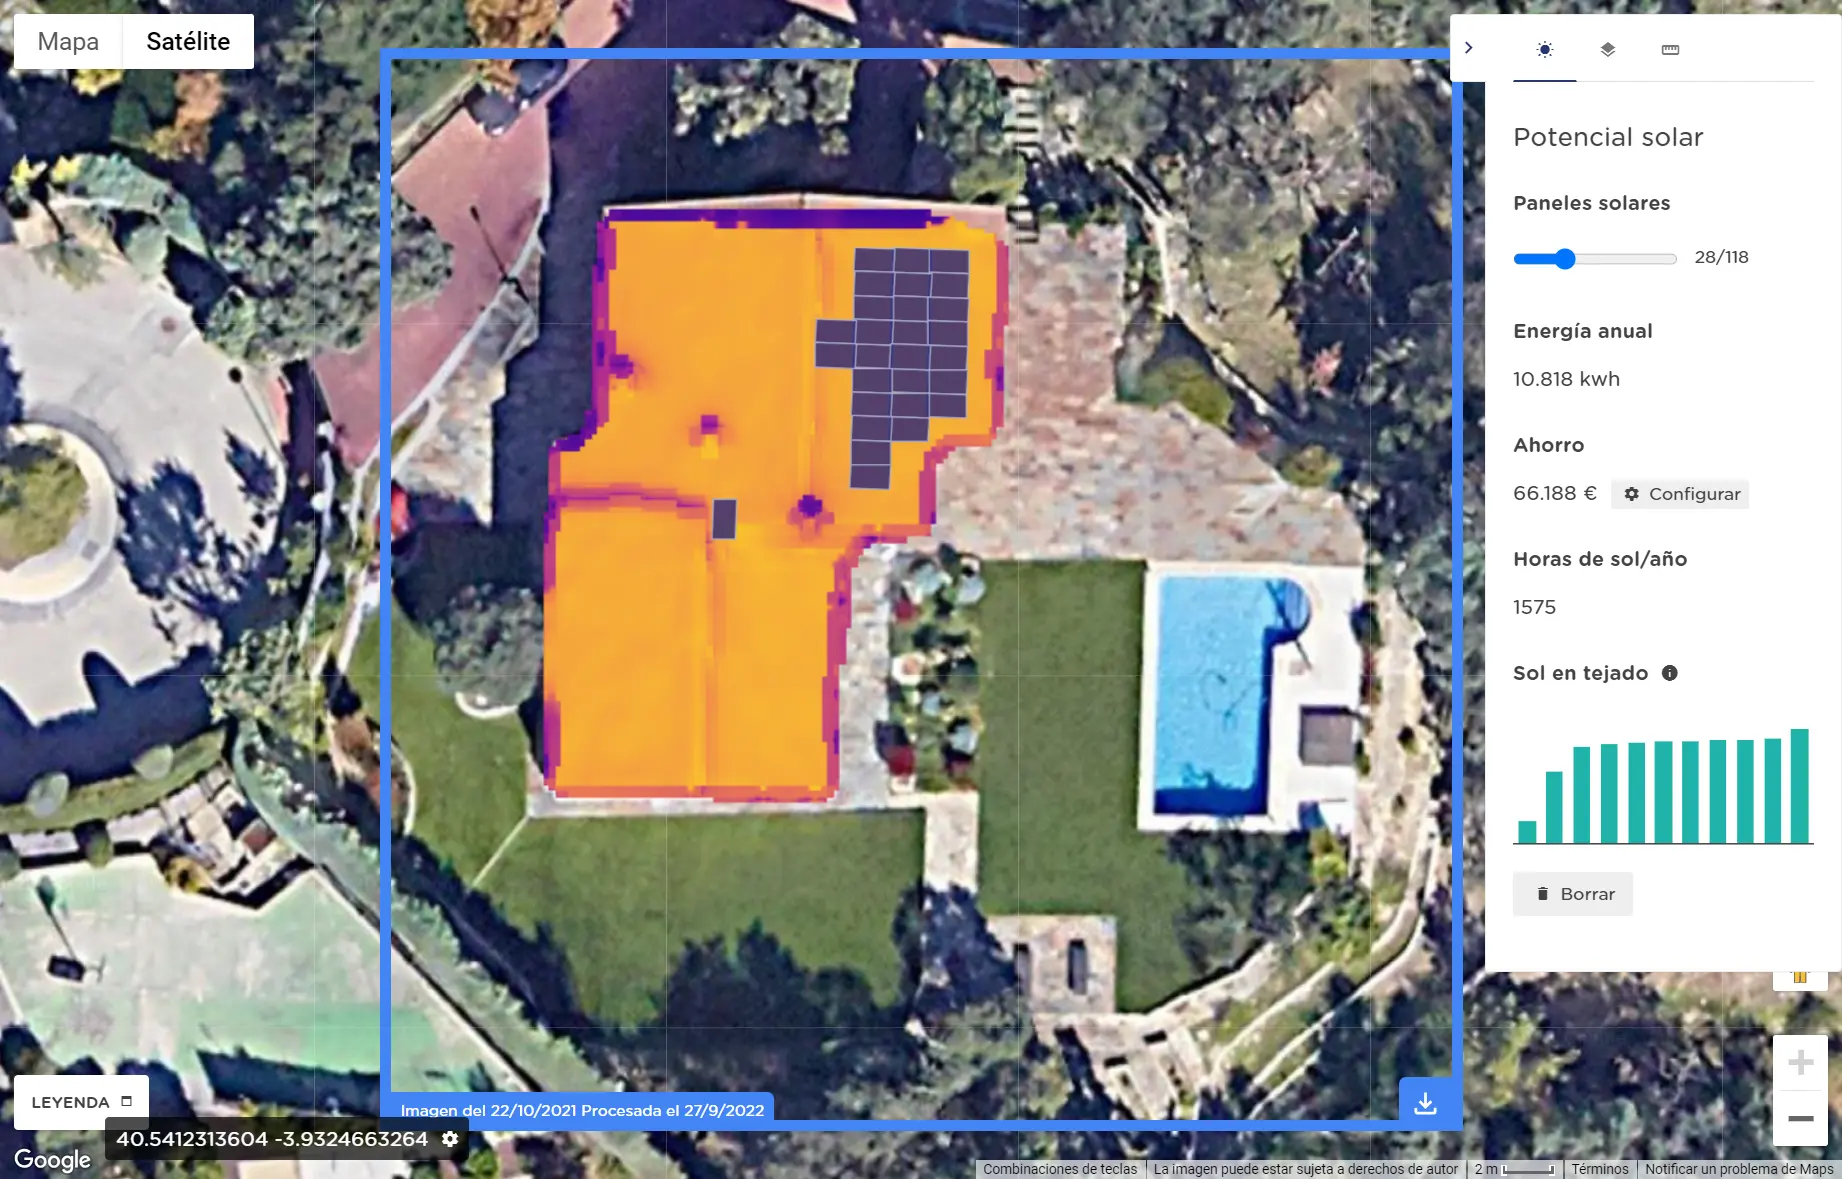
Try different numbers of panels
Select a roof and adjust the number of panels. The map shows the proposed layout and the results panel estimates how much energy it could produce each year.
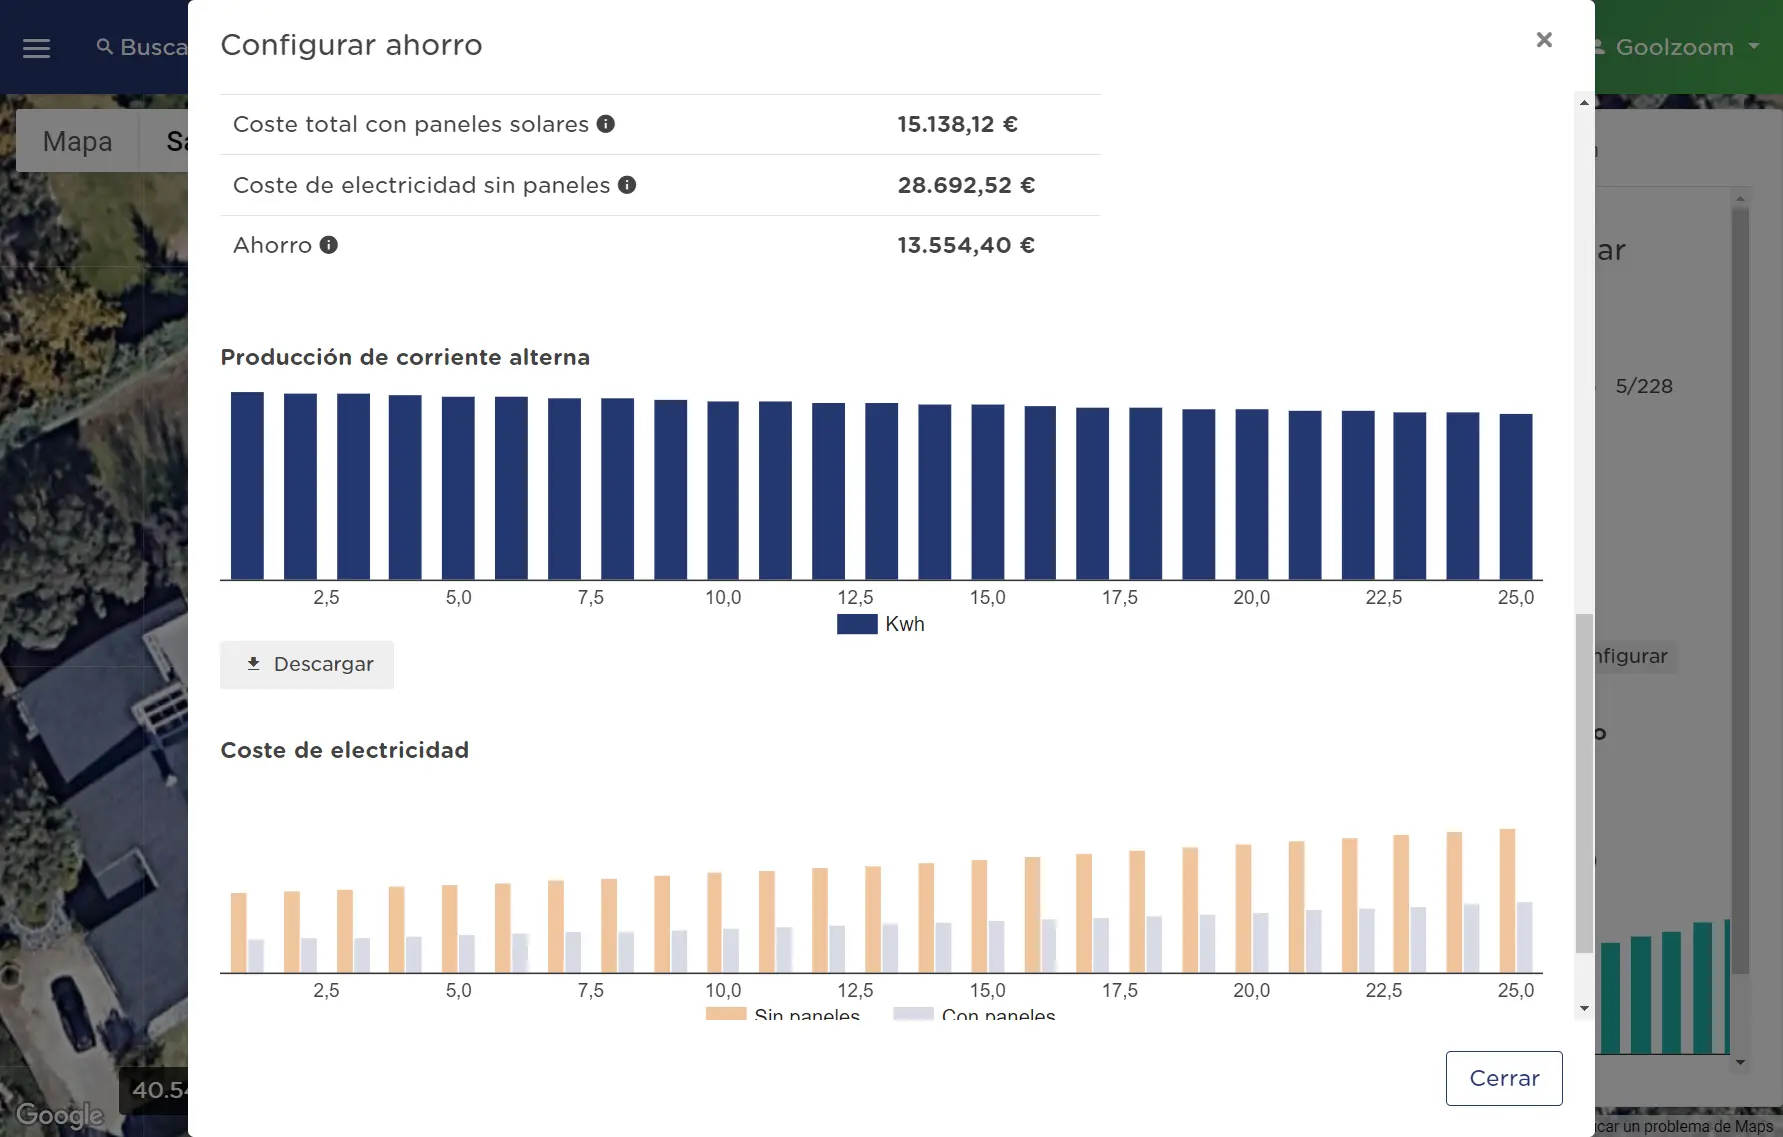
Compare costs with and without panels
Enter your monthly electricity use and bill amount, then adjust the installation cost. Compare estimated costs with and without solar panels over the period you choose.
Estimated savings vary with electricity use, electricity prices and installation costs.
Check coverage in your area
My Roof uses data from Google’s Solar API. Availability and detail vary by location and building.
View Google’s coverageStart with a roof you know
Search for the address, select the roof and explore its solar potential.
Open My Roof
You need a Goolzoom account to use My Roof.